
Analyze and visualize data
Data accessible using download services (WFS)
All datasets described in metadata records that are accessible through a download services (ie WFS) can be analyzed to improve search and data visualization. The catalog collects WFS features and indexes them using Elasticsearch.
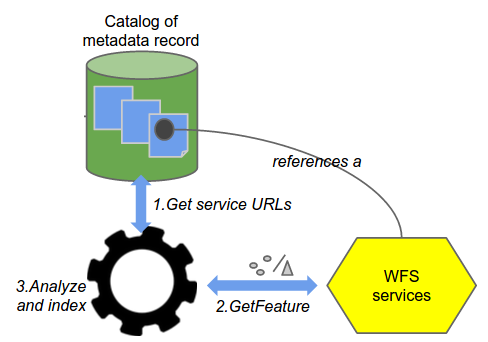
Once collected, filtering is available in the map viewer for this layer. The filter interface provides faceting and export capabilities. The map viewer tries to connect to a WFS service by substituting WMS by WFS in the service URL. If a WFS service responds with a feature type having the same name as the WMS, the filter panel is displayed.
Note
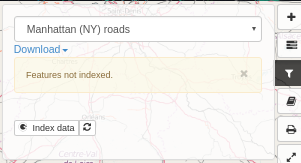
If the filter does not display at all or the list of features (data fields) is not visible, email the exact name of the catalog entry (the Title element) to NAL-GeoData@ars.usda.gov and request that it be added to the index.
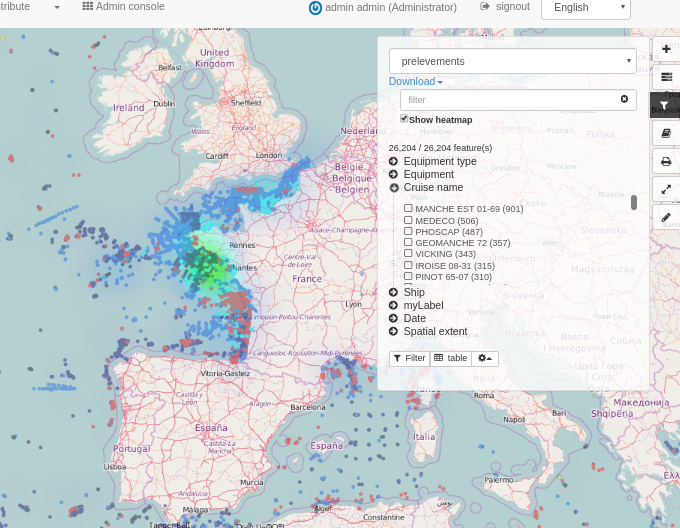
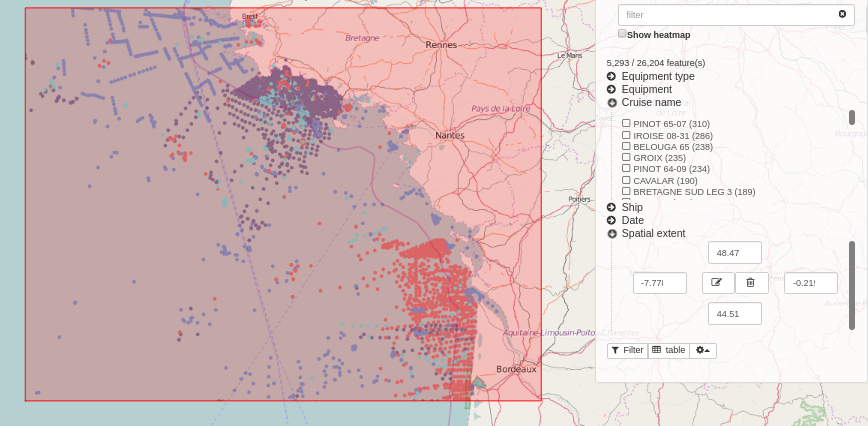
Once indexed, all users can the filtering menu that includes:
full text search on all fields
a check box to display the heatmap
facets on all fields (with an automatically computed numeric range facets)
table action display all values
a Filter text box for SLD filters to be applied to the WMS layers.
Note
Styled Layer Descriptions (SLD) is the Open Geospatial Consortium (OGC) standard that extends WMS to allow user-defined symbolism of feature data.
Click on the table menu to display the attributes. Double click a row in the table to zoom to a feature.
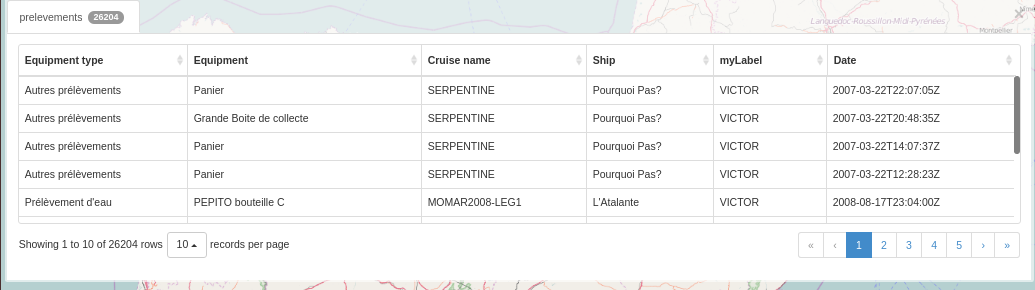
Spatial filters can also be applied.
Feature type customization
By default, the filter panel is generated from Elasticsearch index. But you customise it for a specific WFS Feature Type.
The customization is done by a JSON config inserted in the gmd:applicationProfile section of the online resource in the metadata.
Here the options:
{
"fields": [{
  "name": "PNT_PROF",
  // non disponible actuellement
  "type": "double",
  "fq" : {
    "facet.interval": "PNT_PROF_d",
    "facet.interval.set": ["[0,10]", "(10,10000]"],
   or
    "facet.range": "PNT_PROF_d",
    "facet.range.start": "0",
    "facet.range.end": "10000",
    "facet.range.gap": "300"
   or
    "facet.range": "PNT_PROF_d",
    "facet.range.classes": "5" // Get min, max and compute gap on 5 classes
  }
}, {
  "name": "GRIDCODE"
}, {
  "name": "LABEL",
  "label" : {"fr": "monLabel", "en": "myLabel"}
}],
"tokenize": {"GRIDCODE": ",", "PARCELLE": "/"},
"heatmap": true
}
You can
restrict the fields used for filter
specify your own ranges for numeric values
set your label
manage tokenized fields
enable heatmap